
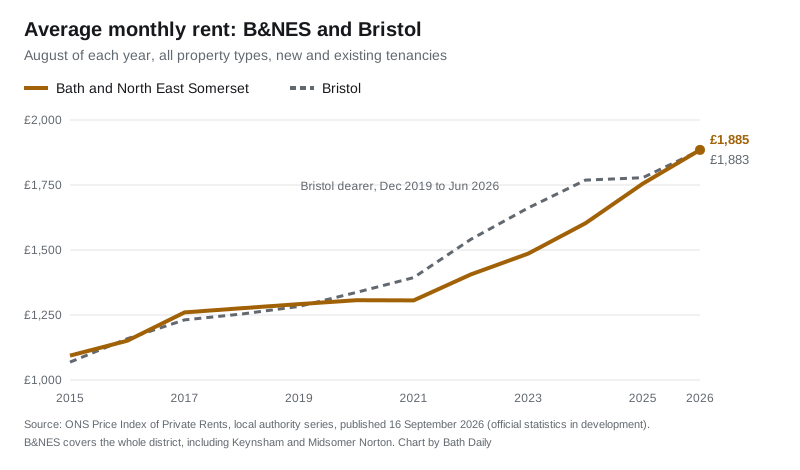
Average rent in Bath and North East Somerset hit £1,885 a month in August, £2 above Bristol and up 7.4% in a year. It is not a first: B&NES led until 2019.
Renting a home in Bath and North East Somerset now costs more on average than renting in Bristol. The average private rent in the district was £1,885 a month in August 2026, according to the Office for National Statistics. In Bristol it was £1,883.
That is a gap of £2 a month, so the two are in practice level. But the direction is clear. Rents in B&NES rose 7.4% in a year, against 5.9% in Bristol, and the district has now been the dearer of the two for two months running (ONS Price Index of Private Rents, 16 September 2026).
One correction to the way this is being reported: it is not the first time. The same ONS series runs back to January 2015. B&NES was dearer than Bristol in most months from 2015 to November 2019. Bristol then led every month from December 2019 to June 2026. What happened in July was B&NES taking the lead back after six and a half years.
The figures
All figures are the ONS average monthly rent for August 2026, covering new and existing private tenancies.
| B&NES | Bristol | South West | England | |
|---|---|---|---|---|
| Average monthly rent | £1,885 | £1,883 | £1,245 | £1,459 |
| Change in a year | +7.4% | +5.9% | +4.4% | +4.0% |
In cash terms, the average B&NES rent went from £1,755 in August 2025 to £1,885. That is £130 a month more, or £1,560 over a year.
Of the 26 South West council areas in the ONS series, only one saw rents rise faster: Tewkesbury, at 13.4%, where the average rent is £1,093. B&NES and Bristol are now the two most expensive places to rent in the region by a wide margin. South Gloucestershire is third, at £1,464.
Why the gap closed
Bristol’s rents went up fast between 2021 and 2024 and then slowed. Between August 2024 and August 2025 the average there rose by just £9, from £1,769 to £1,778. B&NES rents kept climbing steadily through the same period, from £1,603 to £1,755.
At the widest point, in May 2024, Bristol was £214 a month dearer: £1,766 against £1,552. That gap has gone in a little over two years.
Bristol is still dearer for most homes
The headline average hides something worth knowing if you are actually looking for a flat. Break the figures down by size and type and Bristol is still more expensive for most of them.
| August 2026 | B&NES | Bristol |
|---|---|---|
| One bedroom | £1,207 | £1,225 |
| Two bedrooms | £1,523 | £1,544 |
| Three bedrooms | £1,811 | £1,759 |
| Four or more bedrooms | £2,535 | £2,546 |
| Flat or maisonette | £1,392 | £1,508 |
| Terraced house | £2,021 | £2,008 |
| Semi-detached house | £2,003 | £2,091 |
| Detached house | £2,399 | £2,106 |
So a one or two-bedroom flat still costs less in B&NES than in Bristol. Flats are the clearest case, at £116 a month cheaper. B&NES only comes out ahead on three-bedroom homes, terraces and especially detached houses, where it is £293 a month dearer.
The overall average is higher because of the mix of homes being rented, not because every home costs more. That matters for a reader comparing a move between the two cities.
What it means for you
- If you rent in B&NES, the typical rent rose by £130 a month over the year to August. For one-bedroom homes the rise was 7.5%, to £1,207, and for two-bedroom homes it was 7.7%, to £1,523.
- If you are choosing between Bath and Bristol, compare like with like. For a one or two-bedroom flat, Bristol is still slightly dearer on these figures.
- Rent and house prices are moving in opposite directions. The Land Registry’s average house price in B&NES was £409,045 in July, down 0.7% on a year earlier (HM Land Registry UK House Price Index). We covered that in our report on the July house price figures, and keep the latest on our Bath house prices page.
- If you have a problem with a landlord, our report on the council’s proposed landlord fines sets out the penalties it wants to charge landlords who break the rules.
About these figures
- The ONS figures are for the whole Bath and North East Somerset council area. That takes in Keynsham, Midsomer Norton, Radstock and the villages, not only the city of Bath. The ONS does not publish a figure for Bath alone.
- They come from the Price Index of Private Rents, which the ONS publishes as official statistics in development. It covers both new lets and existing tenancies, so it moves more slowly than the asking rents on letting websites.
- The rents are averages produced by the ONS from administrative rental data. A £2 difference between two areas is too small to treat as meaningful.
- The house price figure is a mean average, not a median, as the Land Registry publishes it.
The ONS publishes its next local rent figures, for September, on 21 October.
Have your say